Charlotte Case Clearance and Crime Trends
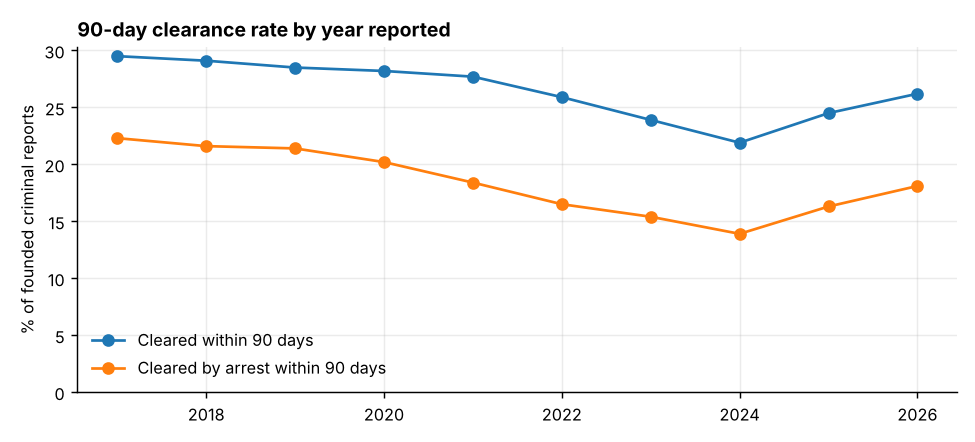
About 1 in 4 crimes reported to the Charlotte-Mecklenburg Police Department (CMPD) is cleared, and only about 1 in 6 is cleared by an arrest. The 90-day clearance rate fell from 29.5% for 2017 reports to a low of 21.9% in 2024, then recovered to 24.5% in 2025. Nearly all clearances happen in the first month: a case still open after 30 days rarely closes.
879,946 CMPD incident reports, Jan 2017 to Oct 28, 2026, plus FBI benchmarks for eight North Carolina agencies. Built with Python, DuckDB SQL, lifelines and statsmodels.
Key findings
- The definition changes the answer by 16 points. For 2023–2025 reports, dividing any "cleared" status by every report gives 32.4%. Following the FBI approach (founded criminal reports only) gives 26.1%. Counting only arrests gives 16.4%. 62% of "exceptional" clearances are cases where the victim chose not to prosecute.
- Clearance fell for seven years, then turned up. Comparing every year at the same 90-day mark (so recent years aren't penalized for having less time), the clearance rate slid from 29.5% (2017) to 21.9% (2024), and the arrest rate from 22.3% to 13.9%. Both rebounded in 2025 (24.5% and 16.3%), and 2026 reports so far are tracking higher still.
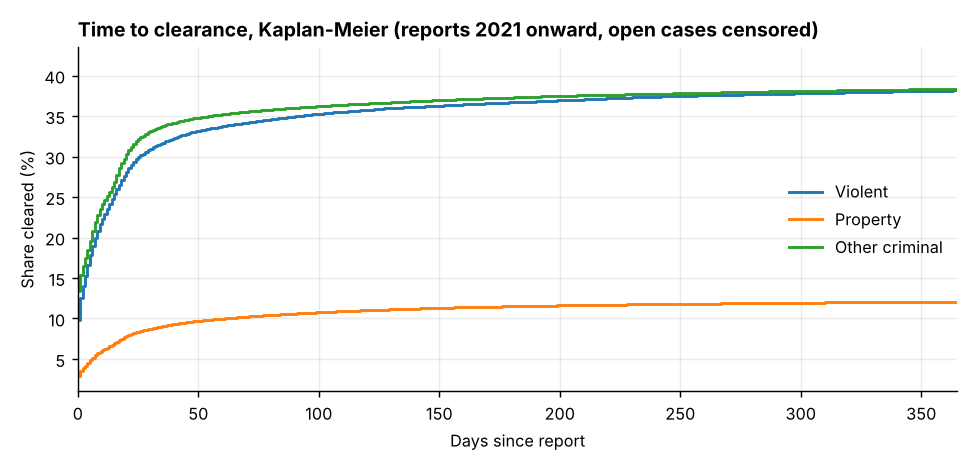
- If it isn't cleared in a month, it probably won't be. Kaplan-Meier curves, which keep open cases in the analysis instead of dropping them, show violent crimes reaching 31% cleared by day 30 but only 38% by day 365. Property crimes reach 9% by day 30 and 12% by day 365.
- Reporting speed is the strongest signal. Crimes reported the same day they began were cleared 37% of the time. Those reported 1–7 days later were cleared 10% of the time, and the rate stays near 12% for later reports. Sex offenses have the longest reporting tail: 10% are reported more than 18 months after they began.
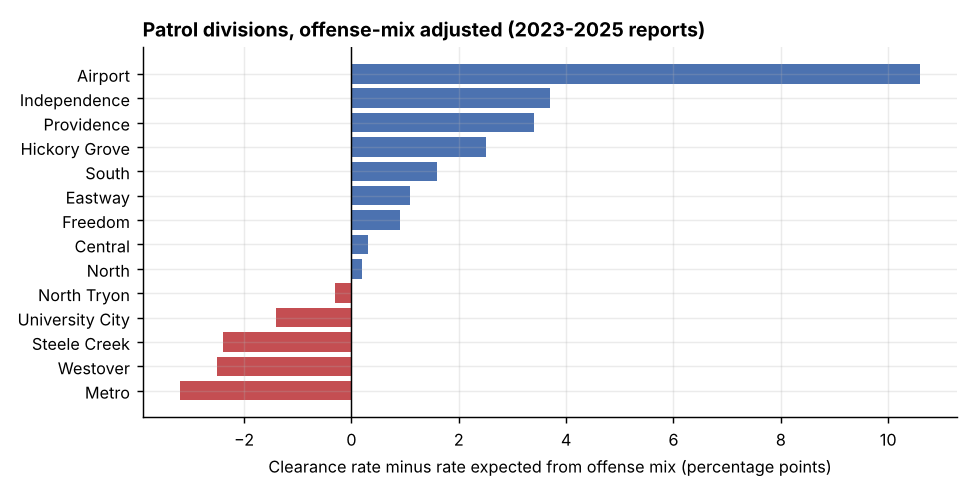
- Divisions differ, but less than the raw numbers suggest. After adjusting for each division's mix of offenses, 12 of 14 patrol divisions sit within ±3.5 points of the citywide expectation. Metro (−3.2), Westover (−2.5) and Steele Creek (−2.4) clear fewer cases than their caseload predicts; Independence (+3.7) and Providence (+3.4) clear more. Airport (+10.6) is an outlier with a small, unusual caseload.
- Violent crime is concentrated. The 10% of neighborhoods (NPAs) with the highest violent-crime rates hold 33% of violent incidents but 7% of residents.
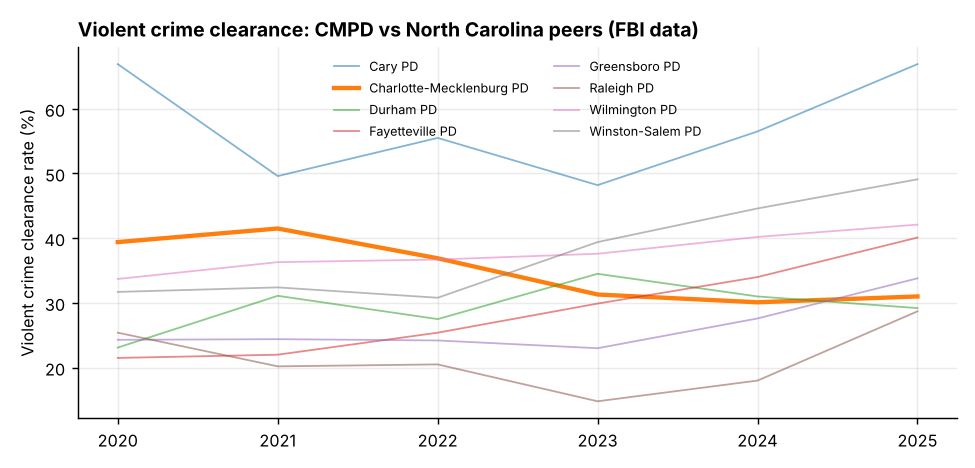
- CMPD sits below most NC peers on violent crime. In the FBI's 2025 figures, CMPD cleared 31.0% of violent offenses, sixth of eight large NC agencies (peer median 40.1%). On property crime, CMPD's 11.5% is in line with peers (median 11.8%).
 |
 |
Clearance-rate definitions
| Term | Rule |
|---|---|
| In scope (denominator) | Founded criminal reports: NIBRS Group A/B offenses, excluding CMPD's non-criminal service reports (codes 8xx: missing persons, death investigations, overdoses) and "Unfounded" reports |
| Cleared (numerator) | Cleared by Arrest, Cleared by Arrest by Another Agency, or Exceptionally Cleared |
| Cleared by arrest | The first two only |
| Pending validation | "Cleared, Pending Arrest Validation" stays open (it is Open in CMPD's status field). Counting it as cleared would add 3 points (q1_definition_comparison.csv) |
| Days to clear | Clearance date minus report date. 49 cleared cases with no or impossible dates are excluded from timing analysis |
| Fixed-window rate | Cleared within 90 days of the report, for reports at least 90 days old, so every year is measured equally |
Dashboard
Open the interactive dashboard. Every table behind it is in reports/tables/, ready to load into Power BI or Tableau.
Questions answered
| # | Question | Output |
|---|---|---|
| Q1 | What share of incidents is cleared, by offense and year? | q1_clearance_by_year.csv, q1_clearance_by_offense_family.csv, q1_definition_comparison.csv |
| Q2 | How long does clearance take? | q2_km_curves.csv, q2_time_to_clearance_summary.csv |
| Q3 | Which divisions and neighborhoods have gaps after controlling for offense mix? | q3_division_mix_adjusted.csv, q3_npa_rates.csv |
| Q4 | How does volume vary by weekday and season? | q4_weekday_month_volume.csv, q4_monthly_volume_stl.csv |
| Q5 | How long between an incident and its report, and does the lag matter? | q5_report_lag.csv, q5_lag_vs_clearance.csv |
| Q6 | How does CMPD compare with NC peers? | q6_fbi_peer_clearance.csv, q6_validation_open_data_vs_fbi.csv |
Data
| Source | Contents | Rows | Terms |
|---|---|---|---|
| CMPD Incidents, City of Charlotte Open Data | One row per incident report: dates, division, NPA, highest NIBRS offense, clearance status and date | 879,946 | City of Charlotte open data terms |
| Quality of Life Explorer, population | NPA boundaries and 2020 population | 457 NPAs | City of Charlotte open data terms |
| FBI Crime Data Explorer | Monthly offenses and clearances for 8 NC agencies, 2020–2025 | 1,152 | Public domain |
Method
- Extraction.
src/extract_cmpd.pypages the city's ArcGIS REST API by OBJECTID. The layer advertises 5,000 records per request, but the server returns 2,500 and sets a truncation flag. The script uses 2,000-record pages, fails loudly on truncation, and checks the final row count against the API's own count (879,946 of 879,946). 84 date values outside 1970–2100 (for example, year 202) are set to null and logged. - Privacy. Street addresses and coordinates are never downloaded. The finest geography is the NPA (457 areas averaging about 2,400 residents).
- Model.
sql/01_model.sqlbuildsfact_incident,dim_offense(NIBRS codes mapped to FBI groups viadata/reference/nibrs_offense_groups.csv),dim_clearance,dim_geographyandfact_fbi_monthly, plus adq_logof integrity checks (zero duplicate IDs, zero unmapped codes). - Survival analysis. Kaplan-Meier estimates of time to clearance for reports since 2021. Cases still open on Oct 28, 2026 are right-censored rather than dropped or counted as failures.
- Offense-mix adjustment. Indirect standardization: each division's expected rate applies the citywide clearance rate for each NIBRS code to that division's own caseload. Gap = actual minus expected.
- Seasonality. STL decomposition of monthly criminal reports; July is the seasonal peak and February the low.
Limitations and ethics
- Reports are not crimes. Reporting rates differ by neighborhood and offense, so incident counts understate some crimes more than others.
- One offense per report. The open data carries only the most serious (highest) NIBRS offense, while the FBI counts every offense and every victim. That is why the FBI counted 5,787 violent offenses for CMPD in 2025 against 3,812 open-data reports. The two clearance rates agree within 3 points for 2024–2025 but diverge in earlier years (
q6_validation_open_data_vs_fbi.csv). - Not official statistics. CMPD publishes official crime statistics separately; this open dataset can be revised.
- Report dates only. The public data has dates but no times, so there is no time-of-day analysis.
- No individual-level or predictive framing. Results are about workload and process, by area and offense. No race, ethnicity or person-level fields are used, and none of this should be read as a reason to police one neighborhood more than another.
Reproduce
pip install -r requirements.txt
python src/extract_cmpd.py   # ~3 minutes, 440 API pages (--what-if to preview)
python src/extract_qol.py
python src/extract_fbi.py
python src/transform.py      # builds data/cmpd.duckdb
python src/analysis.py       # tables, figures, findings.json
python notebooks/_build_notebook.py   # optional: re-execute the walkthrough
Repository layout
src/            extractors (CMPD, QOL, FBI), transform, analysis
sql/            DuckDB model
data/reference/ NIBRS offense grouping
notebooks/      executed walkthrough (01_walkthrough.ipynb)
reports/        tables/ (CSV), figures/ (PNG), findings.json
docs/           data dictionary